


If you’ve ever wondered how developers view and fix website errors, the browser console is where the magic happens. This built-in development tool is available in most modern web browsers and provides a window into the inner workings of a web page. It allows developers to view and debug the underlying code in real time, including JavaScript, HTML, and CSS.
The most popular method for printing data to the console is console.log. However, it is limited to simply printing a message. There are other, less-known methods that offer more functionality and flexibility for various scenarios.
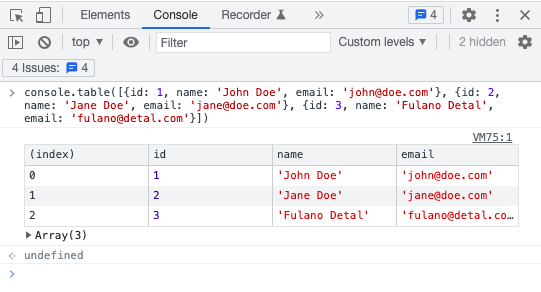
1. Bring Data to the console.table!
The console.table
Imagine you have an array of objects representing users and their information (name, age, city of birth, etc.). Using console.log to print the entire array could result in a long, unorganized list that is difficult to read. However, with console.table you can convert the array into a table format that clearly displays each user’s information in a separate row and column.
Additionally, console.table allows you to sort and filter the data to display only specific information that you need. This can be especially helpful when working with large data sets or when trying to quickly identify specific patterns or trends within the data.
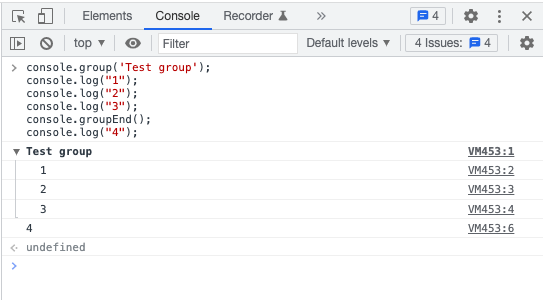
2. Group Multiple Logs with console.group
Group multiple logs together which can be expanded or collapsed!
Use console.group to start a new group, name it, and any log you make from that point on will be part of the group until you close it with console.groupEnd.
This method helps organize and structure your logs, making it easier to analyze and understand the flow of your program.
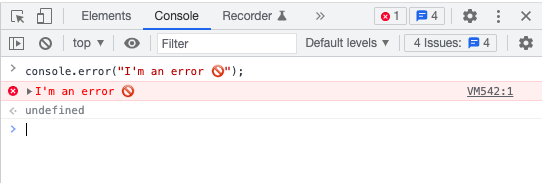
3. Pinpoint Errors with console.error
In web development, identifying and fixing errors is crucial for creating a smooth user experience. When an error occurs, the console.error method prints a message in red text with an “error” icon next to it, making it easy to spot.
Additionally, these error messages can be filtered in the console, allowing you to focus solely on fixing the errors without being distracted by other console messages. By utilizing the console.error method, you can improve the quality and reliability of your web applications.
Keep in mind that console.error should be used to log actual errors in your code, not just any message you want to stand out. Using it excessively for non-errors could clutter the console and make it harder to spot actual errors.
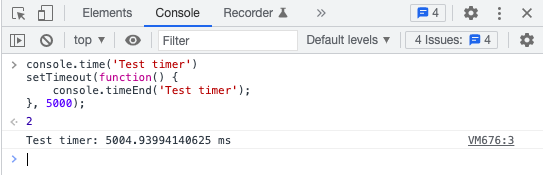
4. Perfect Timing with console.time & console.timeEnd
The console.time and console.timeEnd methods are used to measure the time it takes for a particular section of code to execute. They help us identify how long our code takes to run from one point to another.
When console.time is called, it starts a timer. When console.timeEnd is called with the same label, it stops the timer and logs the elapsed time.
These methods are useful in situations where you need to measure the performance of a particular piece of code. For example, you can use them to compare the performance of different algorithms or to identify performance bottlenecks in your code.
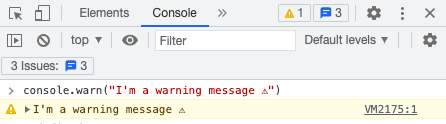
5. Prevent Disasters with console.warn
The console.warn method is similar to console.error, but it is used to print warning messages instead of error messages.
This method is useful for indicating potential issues or errors that may occur if certain conditions are not met, but are not severe enough to be considered fatal errors. For example, a warning message may indicate that a function is deprecated and should not be used in future versions of the software.
Recap: Browser Console Proficency
Mastering the browser console is a powerful tool that developers rely on to view and fix website errors. By utilizing lesser-known methods like console.table, console.group, console.error, console.time, and console.warn, developers can enhance their debugging capabilities and gain valuable insights into their code.
These methods provide flexibility in printing and organizing data, pinpointing errors, measuring code performance, and issuing warnings. With a solid understanding of these techniques, developers can efficiently troubleshoot issues and optimize their web development process, ensuring a smooth and error-free user experience.
Ready for more? Take your development skills to the next level with our 5 steps to create APIs at warp speed. Transform your coding journey and achieve efficiency like never before!